Mine Pile Visualizer, Explorador de Acopios y Topología de Circuitos
Aplicación web local-first para explorar topología de circuitos mineros, estado de material en tiempo real, estructura 3D de acopios y datos históricos. Construida sobre Next.js 16 con React Three Fiber.
Contexto de Negocio
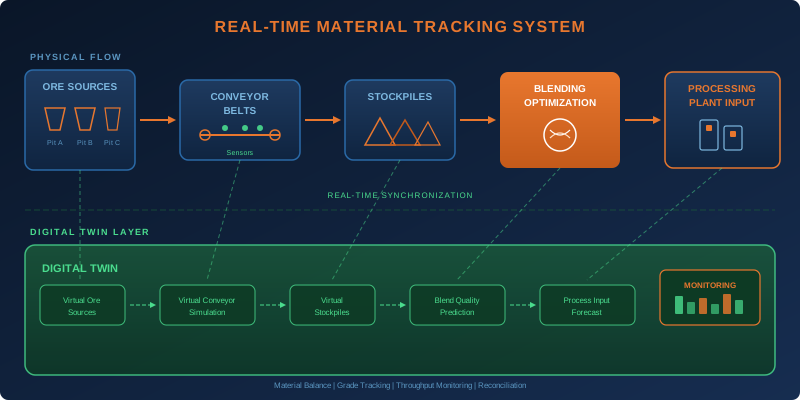
Las operaciones mineras generan terabytes de datos de seguimiento a través de correas, acopios y circuitos de procesamiento. Operadores e ingenieros de proceso necesitan respuestas a preguntas operacionales específicas en tiempo real (estado actual de acopios, tendencias de calidad de alimentación, estado del flujo del circuito) pero las herramientas existentes presentan estos datos como reportes tabulares diferidos o diagramas estáticos que no capturan la complejidad espacial y temporal de la operación.
Valor Estratégico
Al proveer cuatro espacios de trabajo diseñados para operadores, cada uno orientado a una clase específica de pregunta operacional, la plataforma transforma datos brutos de simulación en inteligencia espacial accionable. La arquitectura local-first elimina dependencias de infraestructura, permitiendo despliegue en cualquier sitio sin requisitos de red. El uso de Apache Arrow IPC para transporte de datos asegura carga sub-segundo de datasets voxel con miles de celdas, haciendo la inspección 3D en tiempo real práctica para operaciones diarias.
El Desafío
Los sistemas de seguimiento de mineral generan enormes cantidades de datos operacionales: composiciones de bloques en correas, estados voxel de acopios, distribuciones de calidad. Los datos existen, pero operadores e ingenieros de proceso necesitan vistas estructuradas y específicas por ruta para responder preguntas operacionales.
Nuestro Enfoque
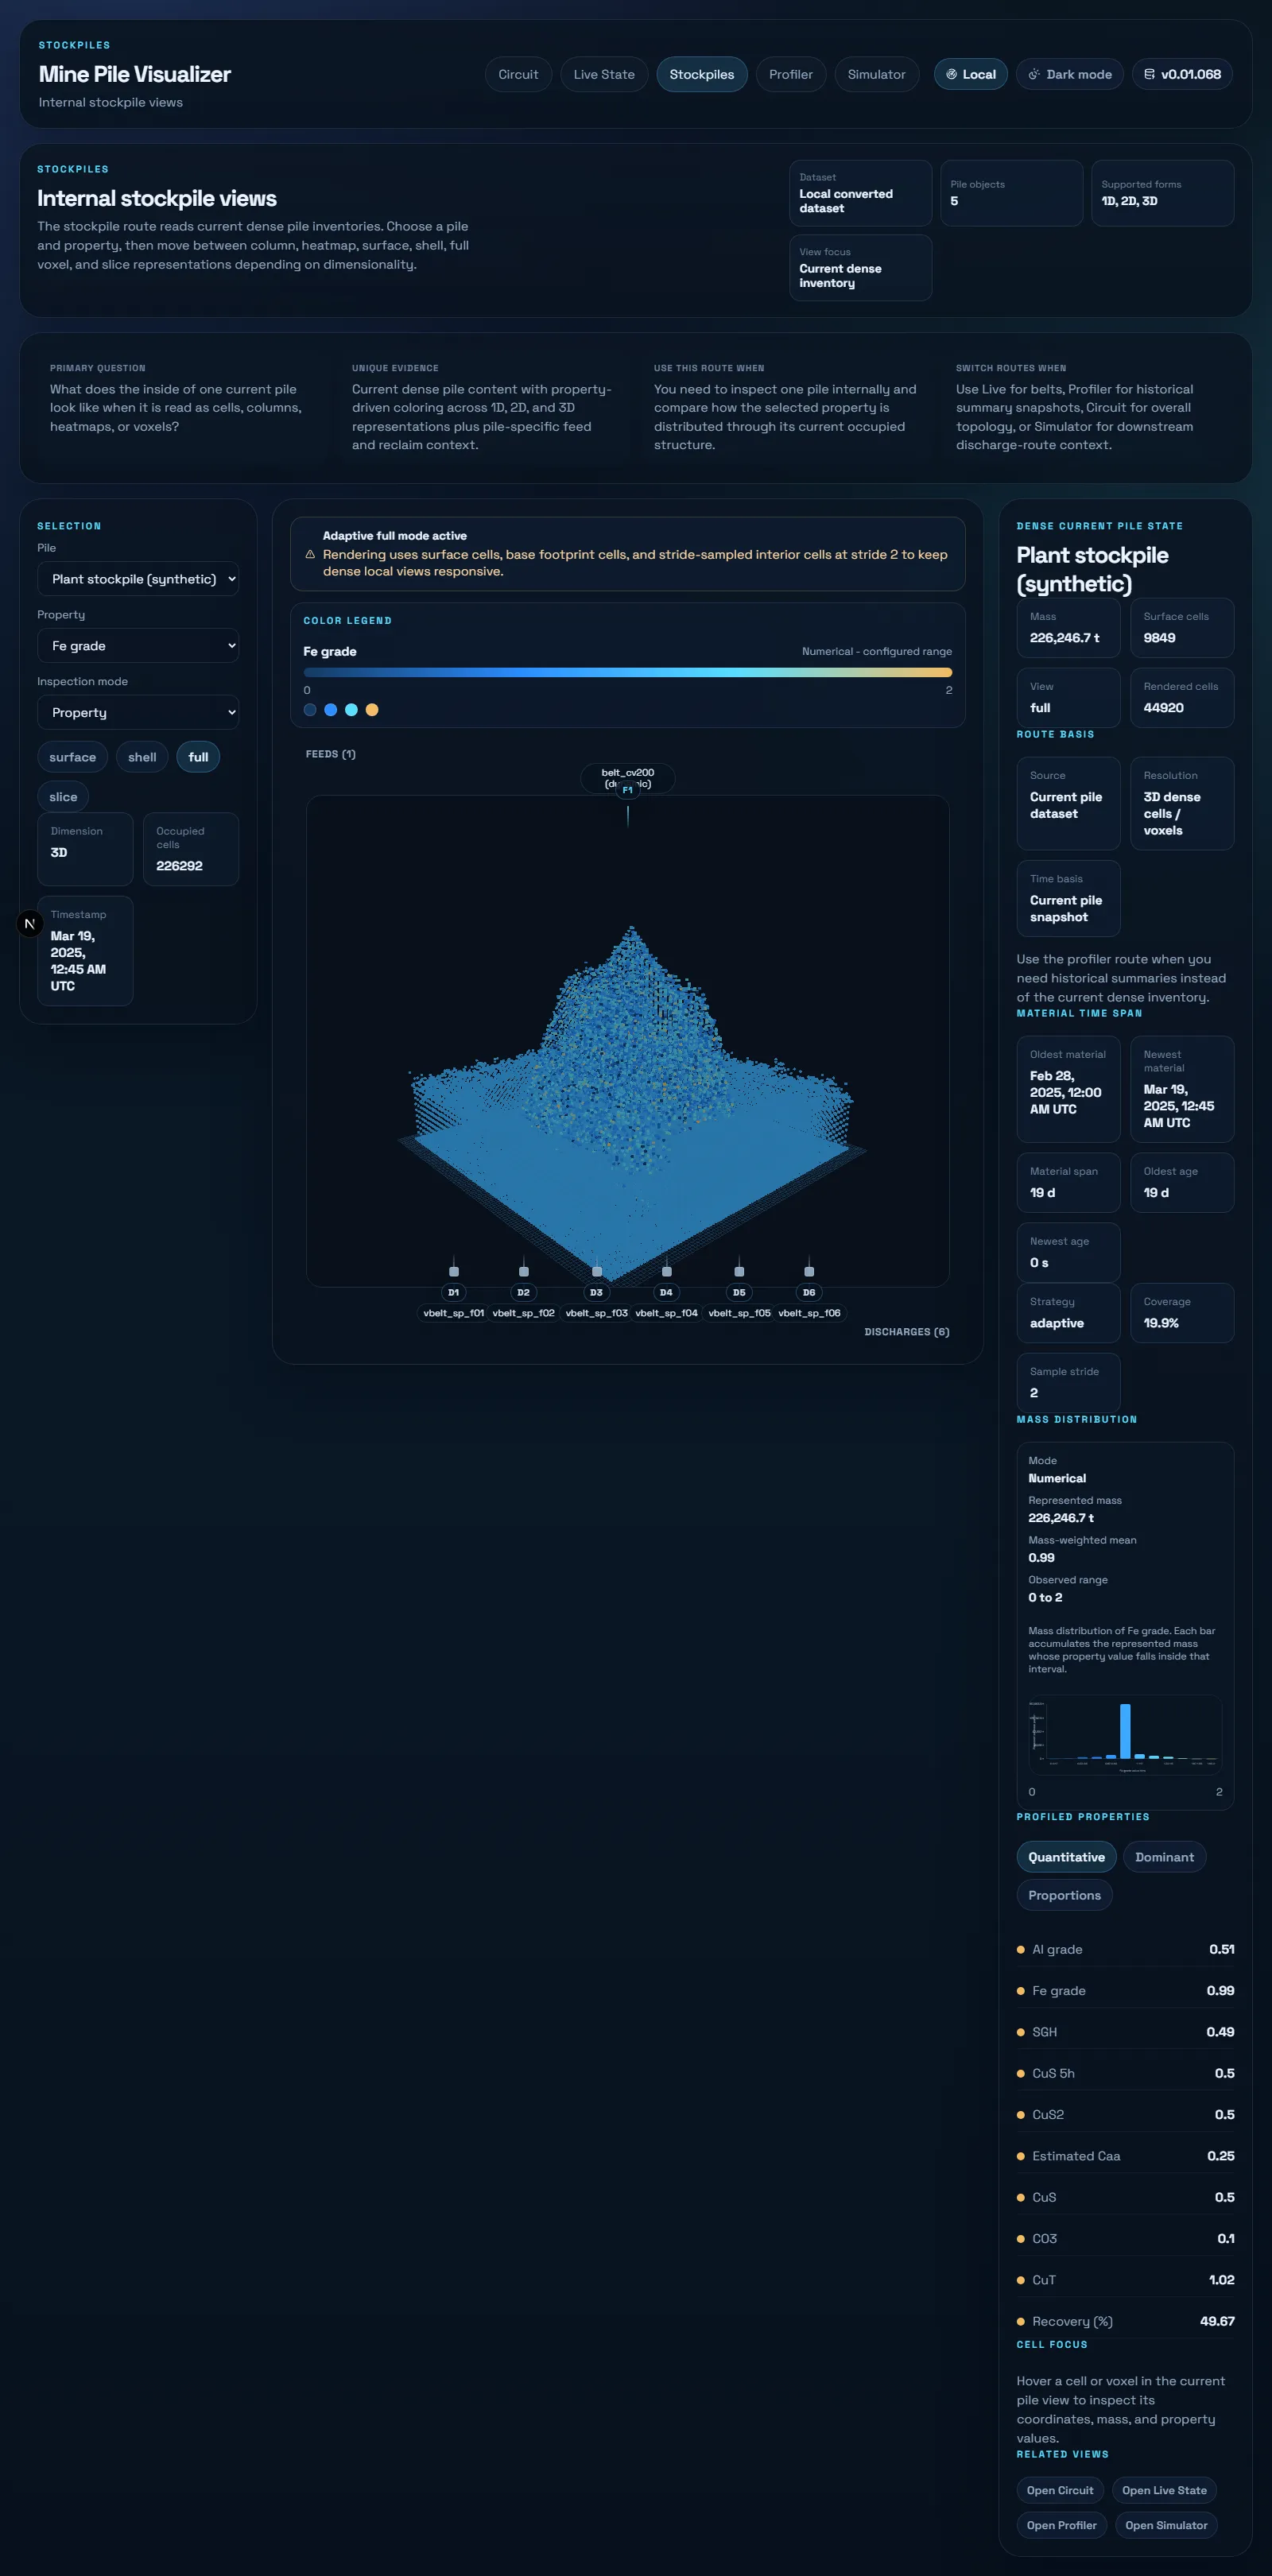
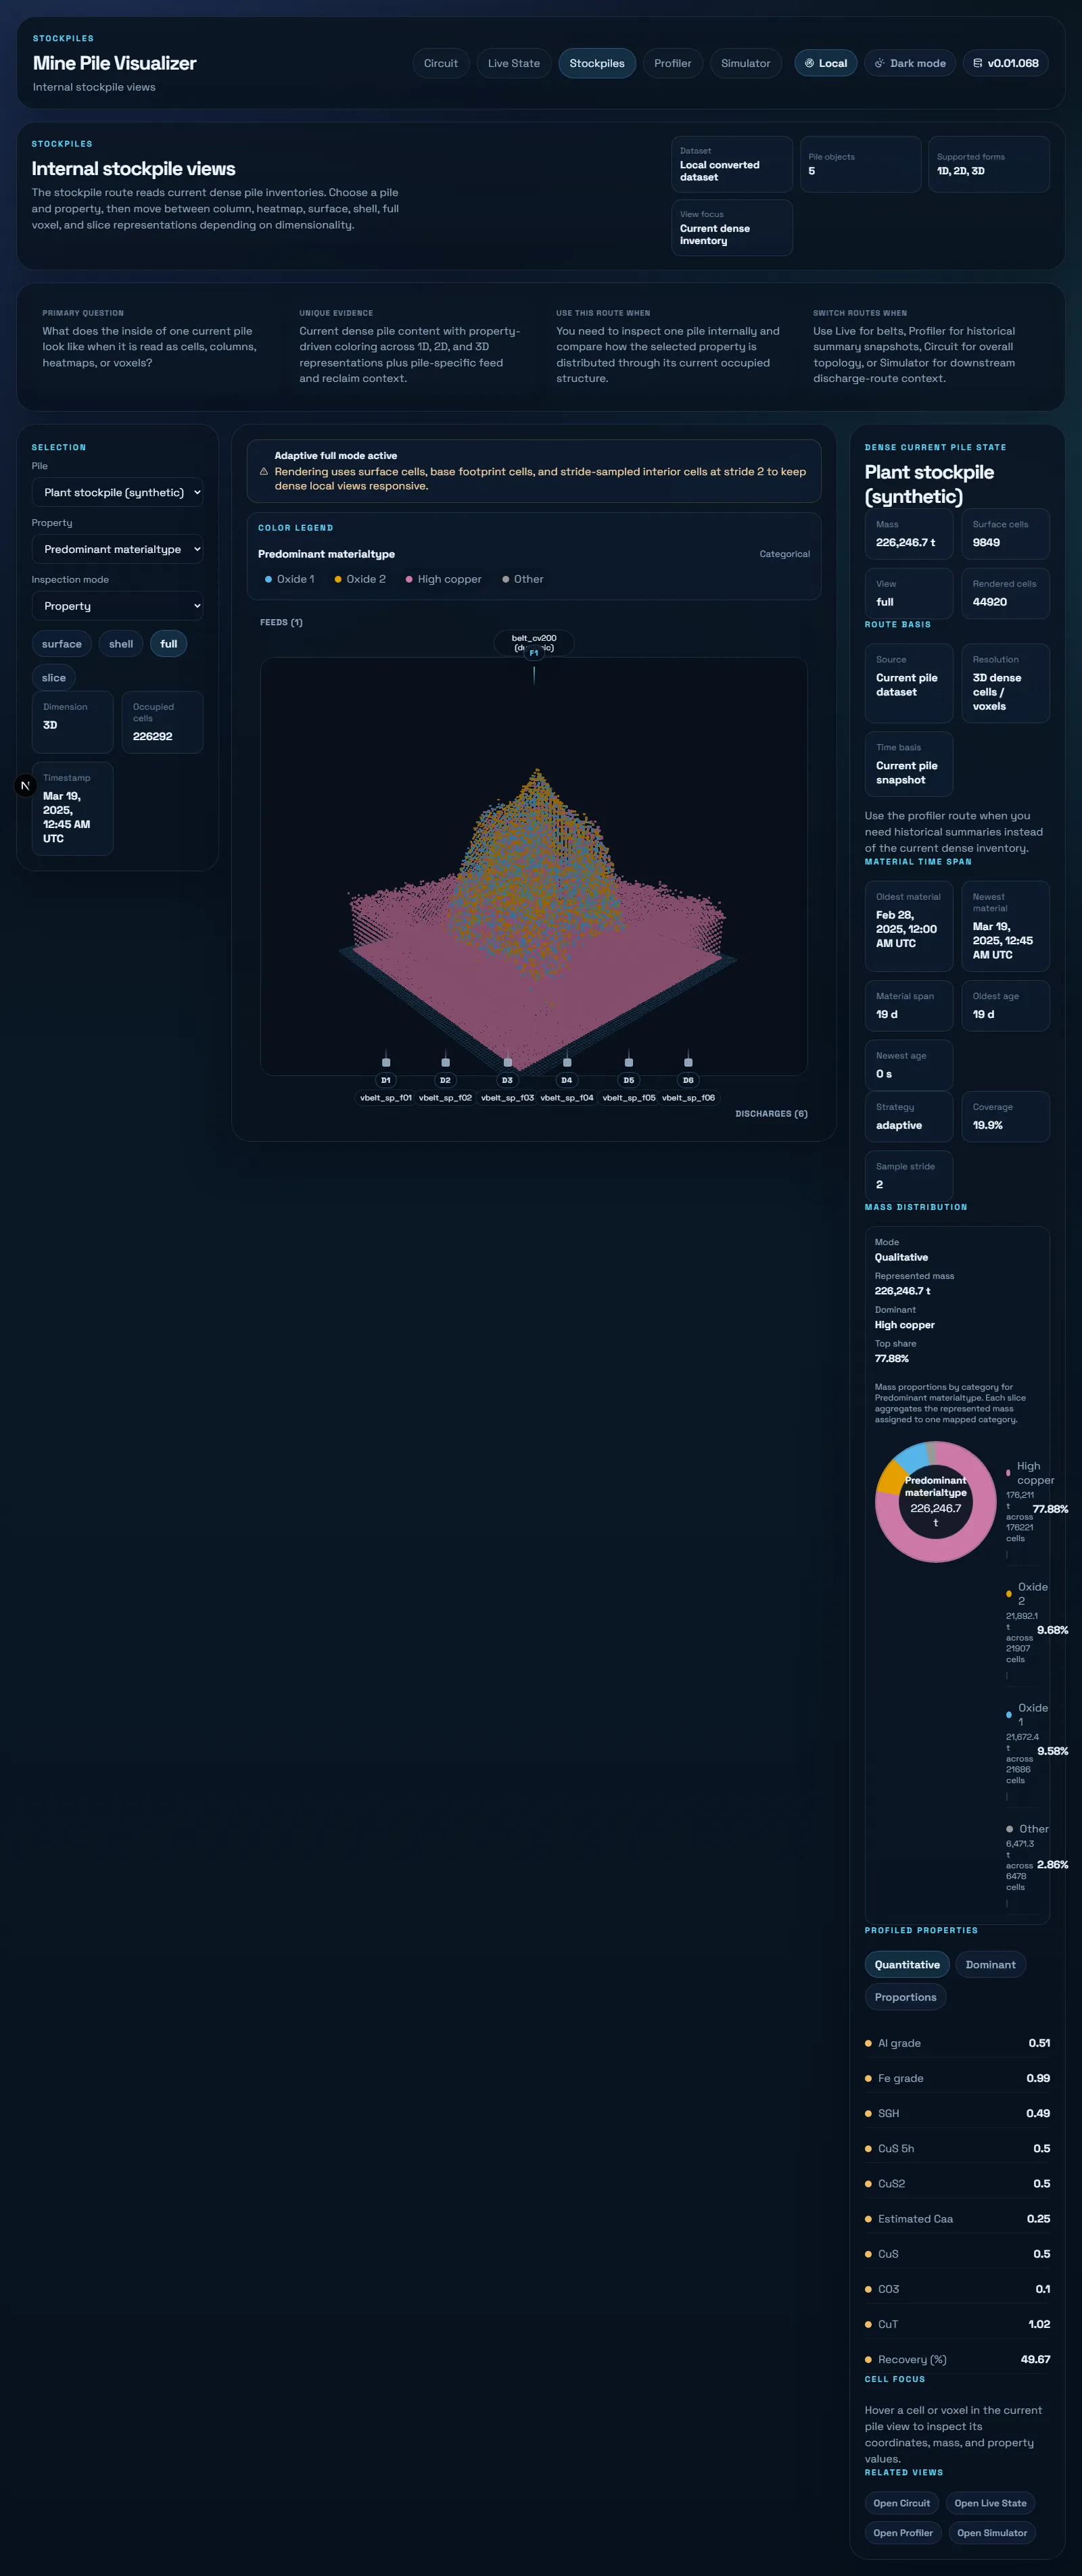
Cuatro espacios de trabajo dedicados para operadores consumiendo datos cacheados en Apache Arrow IPC: Circuito (diagramas de topología 2D/3D interactivos), En Vivo (inspección densa del estado actual con renderizado voxel), Perfilador (navegación de snapshots históricos y series de calidad), y Simulador (lectura de descarga centrada en acopio con visualización de rutas).
Indicadores Clave de Rendimiento
| KPI | Línea Base | Resultado | Impacto |
|---|---|---|---|
| Visibilidad de Estado | Reportes tabulares, diferidos | Vistas 2D/3D interactivas, cache en tiempo real | Comprensión espacial del estado del material |
| Contexto de Decisión | Fuentes de datos fragmentadas | Cuatro espacios de trabajo dedicados | Flujos de trabajo enfocados para operadores |
| Revisión Histórica | Extracción manual de datos | Perfilador con navegación de snapshots | Análisis de tendencias turno a turno |
Arquitectura
material tracking
Why This Exists
Mineral tracking simulation engines generate massive operational datasets: belt block compositions, stockpile voxel states, quality distributions over time. The data is there, but it’s trapped in raw format. Operators need to answer questions in real time: What’s the current state of each stockpile? How has feed quality evolved over the last shift? Where are quality deviations occurring in the circuit?
Mine Pile Visualizer was built to bridge that gap. Rather than building a generic dashboard, the approach was to design four dedicated workspaces, each answering a specific class of operational question through purpose-built visualizations.
Operator Workspaces
The Circuit workspace provides a structural map of the processing circuit. An interactive 2D/3D topology diagram, built with @xyflow/react and automatic dagre layout, shows stages, nodes, edges, flow roles, and anchor inventory. Operators can see how the circuit is connected and where each processing stage sits.
The Live workspace is the real-time pulse of the operation. Belt block compositions appear as color-coded strips; stockpile voxel states render in 3D using React Three Fiber with instancedMesh for performance. Mass histograms, quality distributions, and per-voxel inspection give operators a dense, spatial picture of what is happening right now.
The Profiler workspace handles the historical dimension. Snapshot navigation allows stepping through past states, quality time-series reveal shift-to-shift trends, and delta comparisons between snapshots help identify gradual drift in stockpile composition that operators might not notice day-to-day.
The Simulator workspace focuses on discharge. It visualizes the central pile structure, active discharge routes, and grouped reclaim sequences, answering the question operators care about during extraction: where does the material actually go?
Data Architecture
The system consumes Apache Arrow IPC cached outputs from an upstream mineral tracking engine. Two primary structures carry the data:
Pile cells, (ix, iy, iz, massTon, timestamps, quality columns), represent the voxelized stockpile state. Each cell has spatial coordinates, mass, temporal metadata, and multiple quality attributes.
Belt blocks, (position, massTon, timestampOldest, timestampNewest, qualities), carry conveyor material composition with temporal bounds showing when the material entered and when it was last updated.
The dense binary Arrow format enables sub-second loading of voxel datasets with thousands of cells. The entire architecture is local-first: no external services, no database, no network dependencies. The visualizer reads pre-computed cache from the local filesystem.
Technical Foundation
The application runs on Next.js 16 (App Router) with React 19 and TypeScript 5. Circuit diagrams use @xyflow/react with dagre for automatic graph layout. 3D stockpile rendering uses @react-three/fiber with Three.js and drei, leveraging WebGL instanced mesh for efficient voxel visualization. Zod 4 validates data contracts at runtime, catching schema mismatches before they reach the rendering layer.
Stack Tecnológico
Capturas de la Aplicación