Mine Pile Visualizer — Stockpile & Circuit Topology Explorer
A local-first web app for exploring mining circuit topology, live material state, stockpile 3D structure, and historical profiler data. Built on Next.js 16 with React Three Fiber.
Business Context
Mining operations generate terabytes of tracking data across conveyors, stockpiles, and processing circuits. Operators and process engineers need answers to specific operational questions in real time — current stockpile state, feed quality trends, circuit flow status — but existing tools present this data as delayed tabular reports or static diagrams that fail to capture the spatial and temporal complexity of the operation.
Strategic Value
By providing four purpose-built operator workspaces — each designed around a specific class of operational question — the platform transforms raw simulation data into actionable spatial intelligence. The local-first architecture eliminates infrastructure dependencies, enabling deployment at any site without network requirements. The use of Apache Arrow IPC for data transport ensures sub-second loading of voxel datasets with thousands of cells, making real-time 3D inspection practical for daily operations.
The Challenge
Mineral tracking systems generate vast amounts of operational data — belt block compositions, stockpile voxel states, quality distributions. The raw data exists, but operators and process engineers need structured, route-specific views to answer operational questions about current stockpile state, feed quality evolution, and circuit understanding.
Our Approach
Four dedicated operator workspaces consuming Apache Arrow IPC cached outputs: Circuit (interactive 2D/3D topology diagrams), Live (dense current-state inspection with voxel rendering), Profiler (historical snapshot navigation and quality time-series), and Simulator (pile-centered discharge reading with route visualization).
Key Performance Indicators
| KPI | Baseline | Result | Impact |
|---|---|---|---|
| State Visibility | Tabular reports, delayed | Interactive 2D/3D views, real-time cache | Spatial understanding of material state |
| Decision Context | Fragmented data sources | Four dedicated workspaces | Focused operator workflows |
| Historical Review | Manual data extraction | Profiler with snapshot navigation | Shift-to-shift trend analysis |
Architecture
material tracking
Why This Exists
Mineral tracking simulation engines generate massive operational datasets — belt block compositions, stockpile voxel states, quality distributions over time. The data is there, but it’s trapped in raw format. Operators need to answer questions in real time: What’s the current state of each stockpile? How has feed quality evolved over the last shift? Where are quality deviations occurring in the circuit?
Mine Pile Visualizer was built to bridge that gap. Rather than building a generic dashboard, the approach was to design four dedicated workspaces — each answering a specific class of operational question through purpose-built visualizations.
Operator Workspaces
The Circuit workspace provides a structural map of the processing circuit. An interactive 2D/3D topology diagram — built with @xyflow/react and automatic dagre layout — shows stages, nodes, edges, flow roles, and anchor inventory. Operators can see how the circuit is connected and where each processing stage sits.
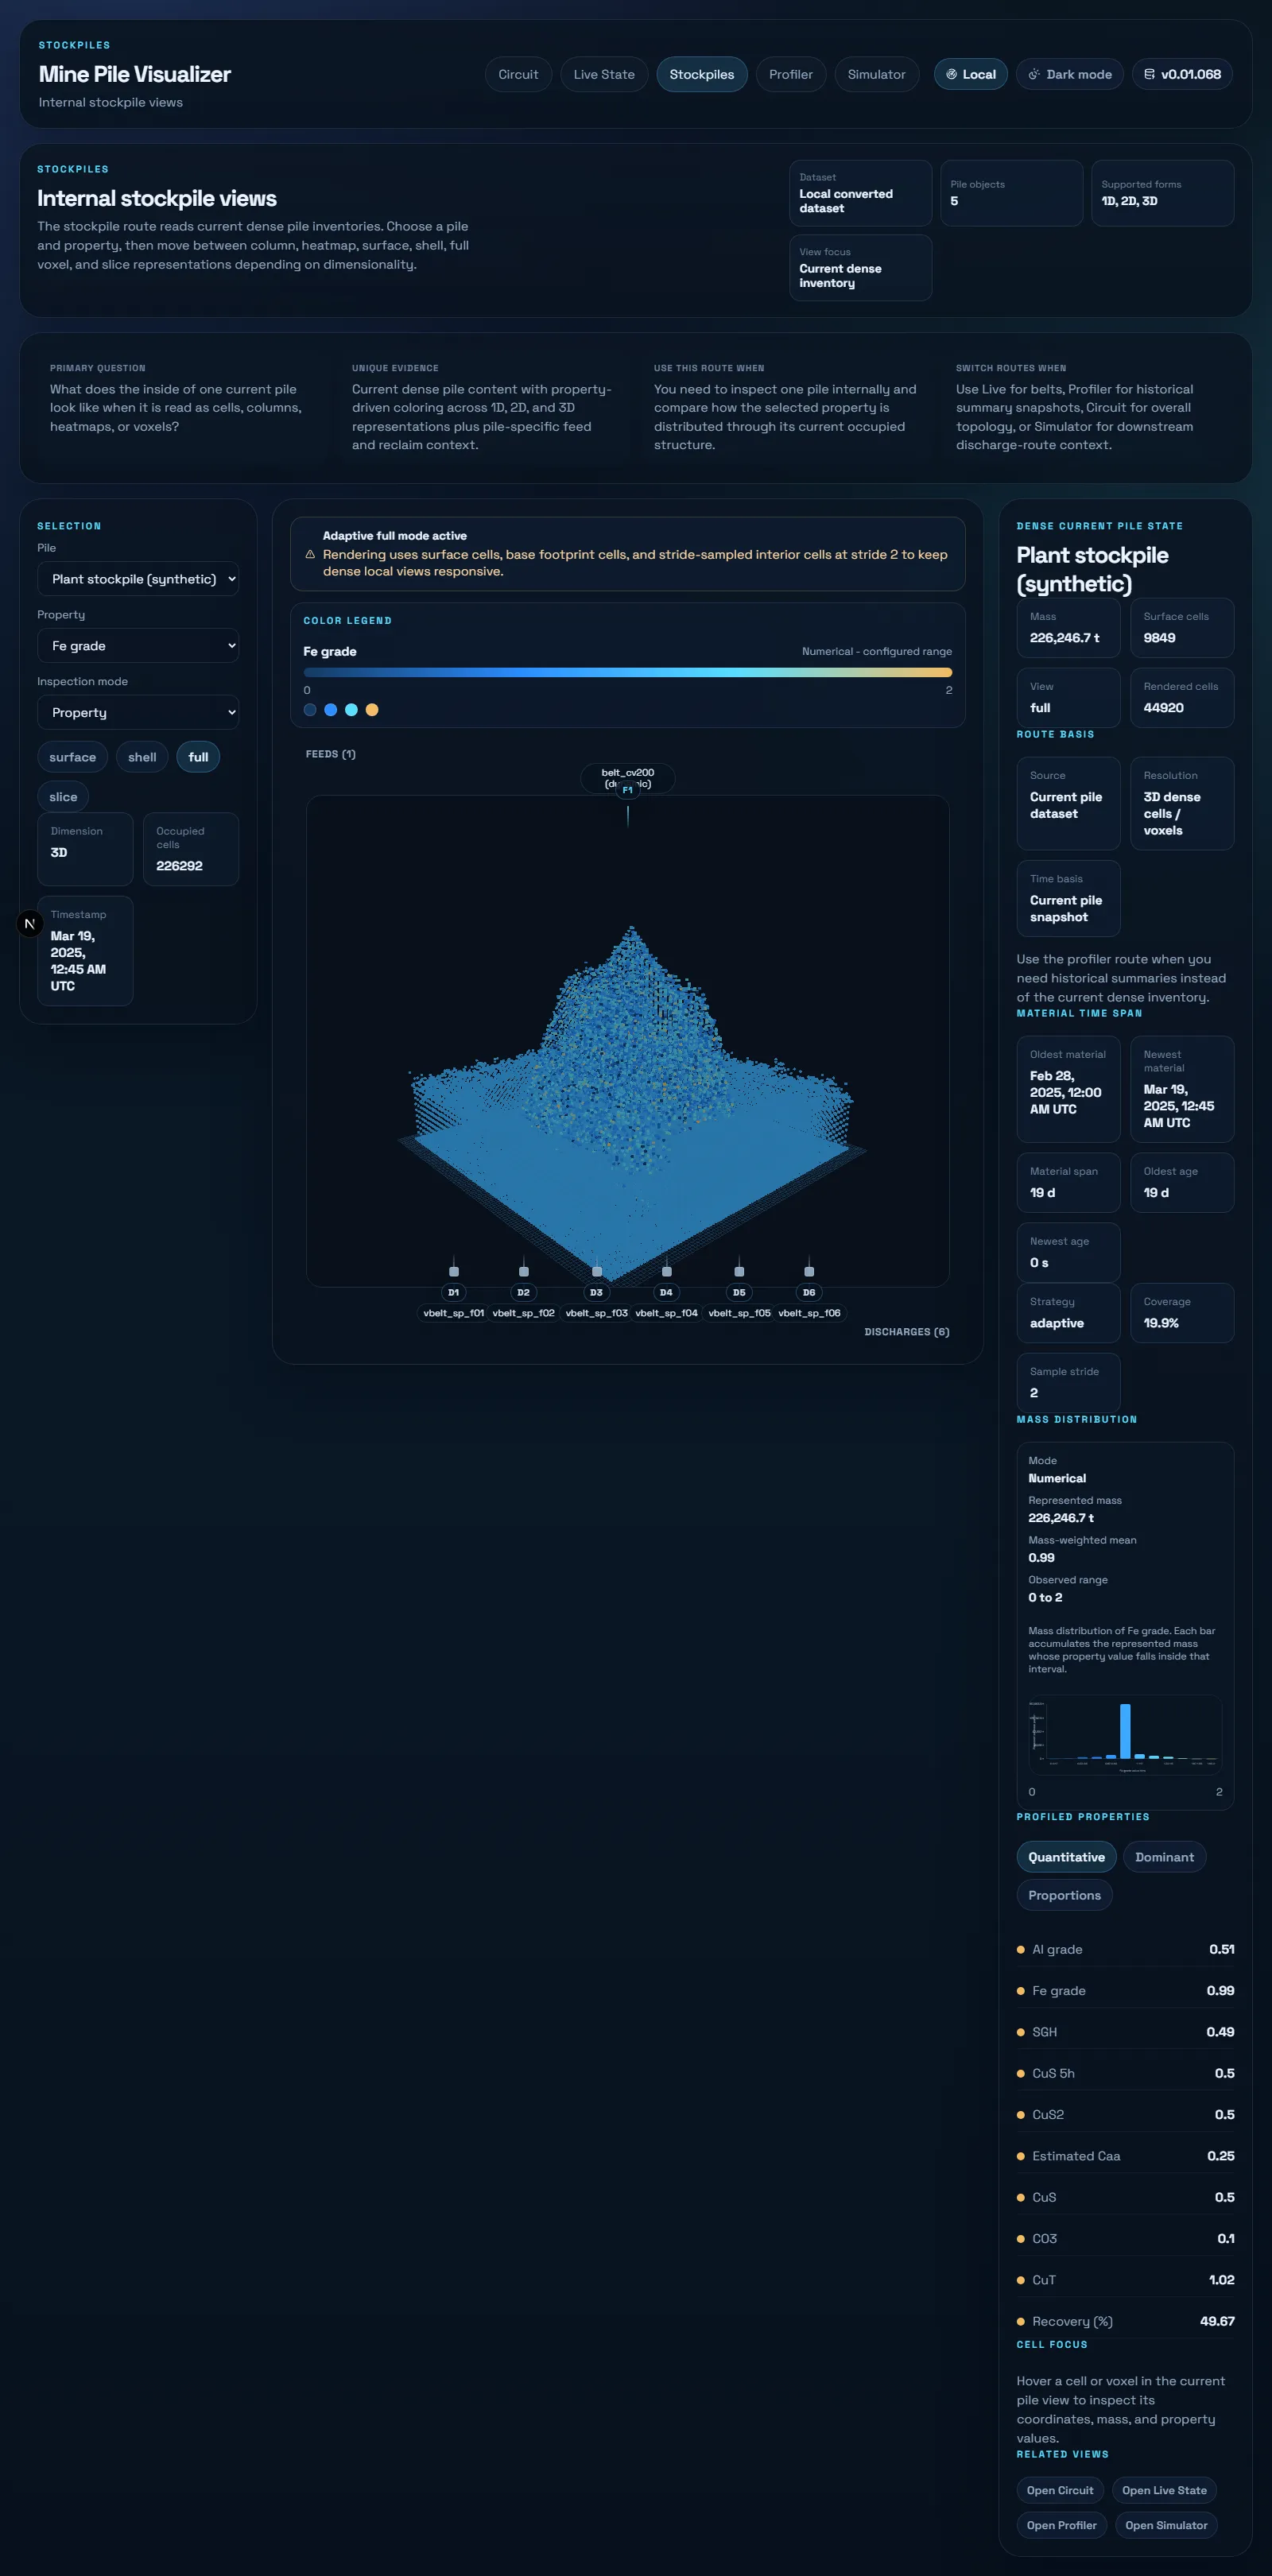
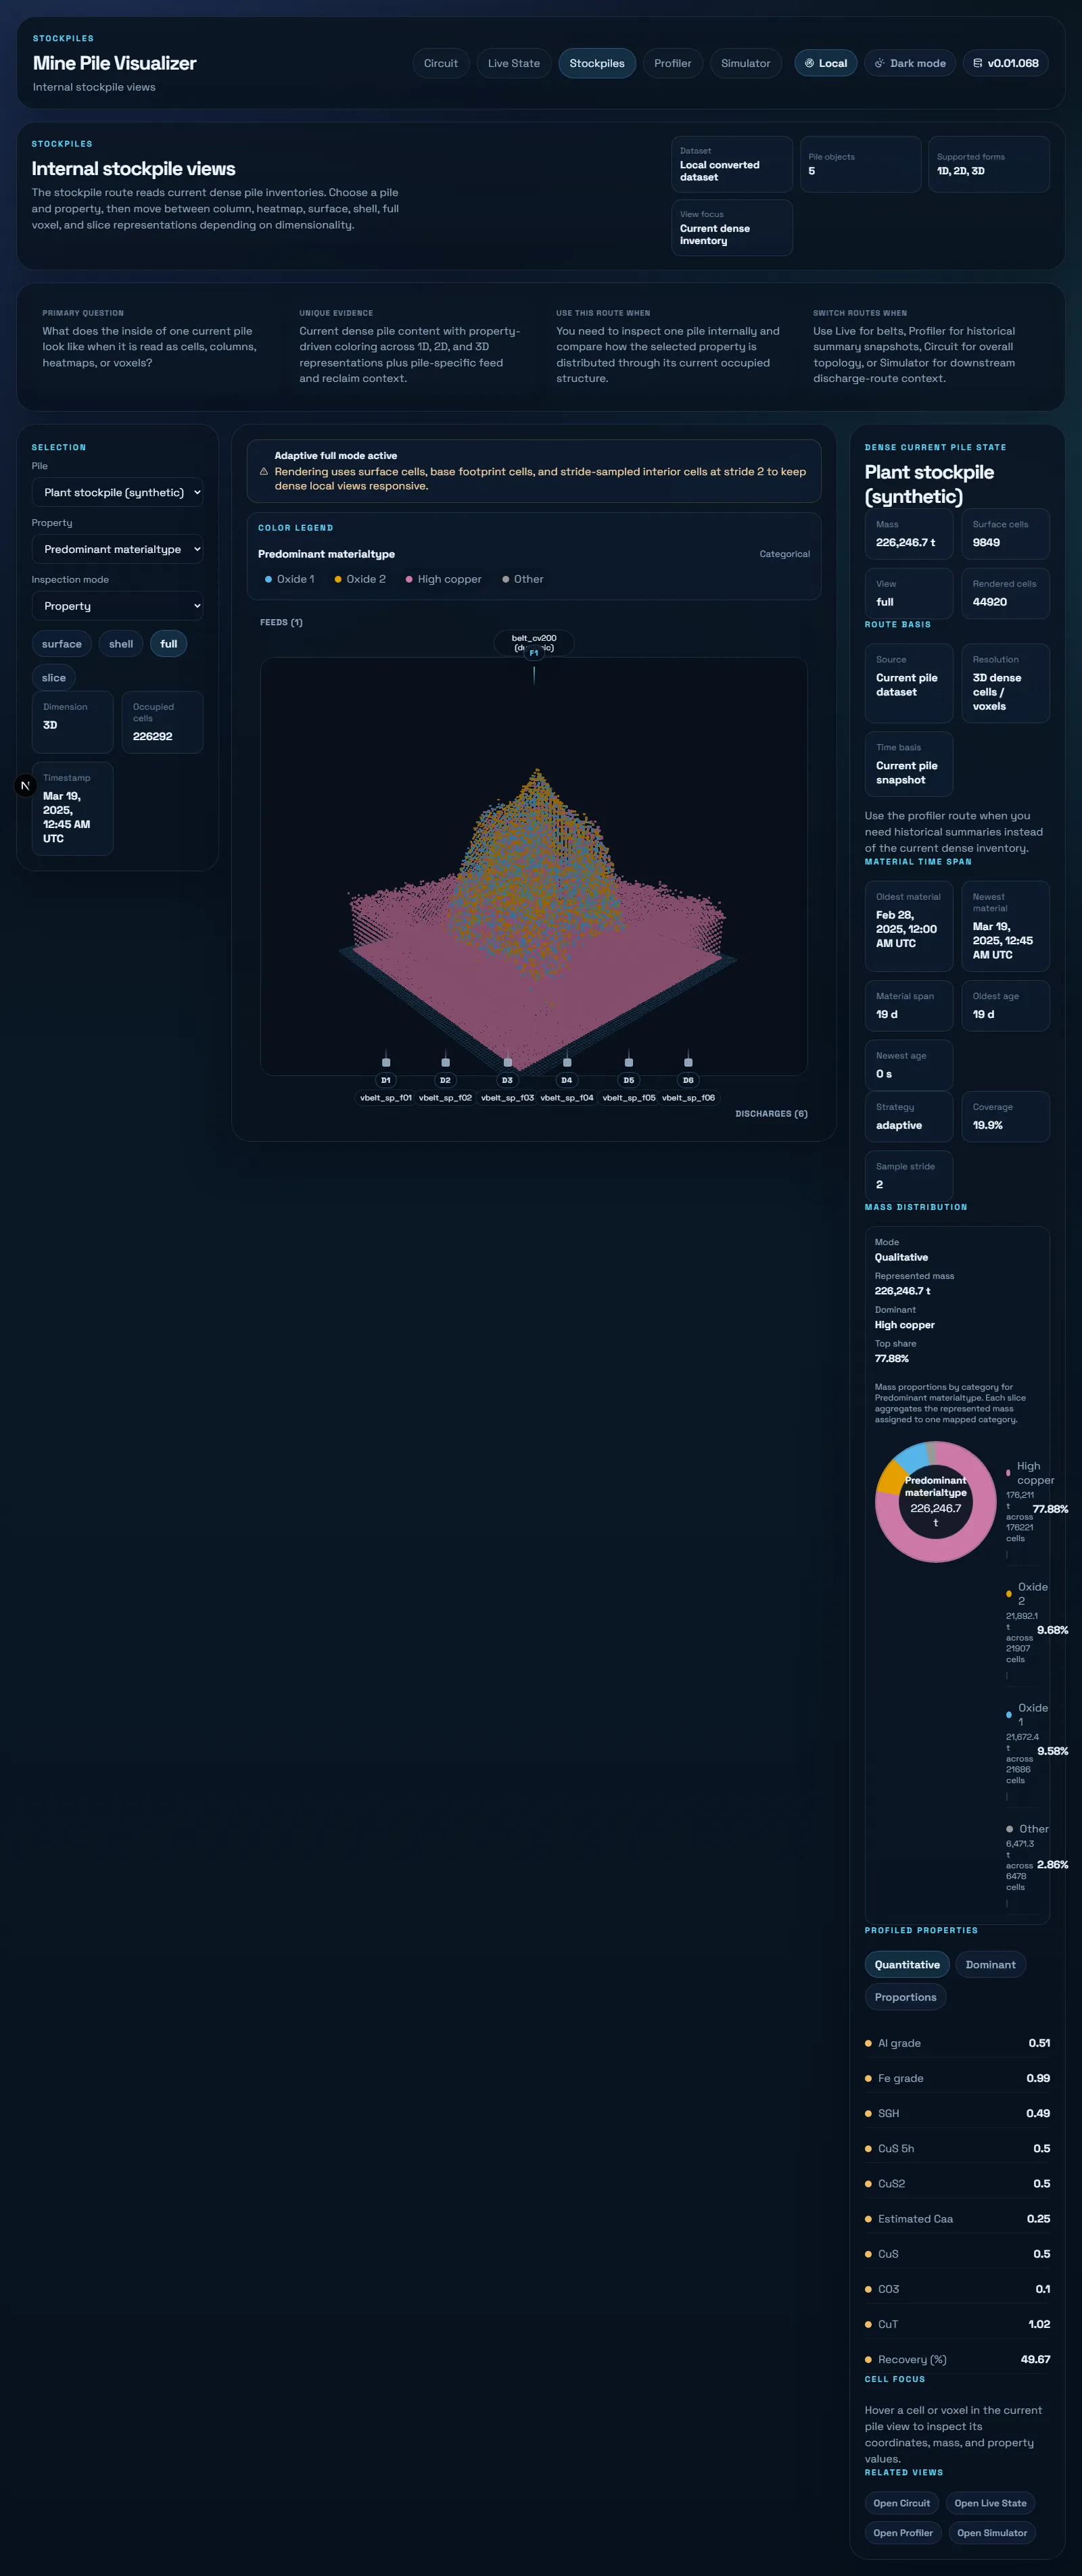
The Live workspace is the real-time pulse of the operation. Belt block compositions appear as color-coded strips; stockpile voxel states render in 3D using React Three Fiber with instancedMesh for performance. Mass histograms, quality distributions, and per-voxel inspection give operators a dense, spatial picture of what is happening right now.
The Profiler workspace handles the historical dimension. Snapshot navigation allows stepping through past states, quality time-series reveal shift-to-shift trends, and delta comparisons between snapshots help identify gradual drift in stockpile composition that operators might not notice day-to-day.
The Simulator workspace focuses on discharge. It visualizes the central pile structure, active discharge routes, and grouped reclaim sequences — answering the question operators care about during extraction: where does the material actually go?
Data Architecture
The system consumes Apache Arrow IPC cached outputs from an upstream mineral tracking engine. Two primary structures carry the data:
Pile cells — (ix, iy, iz, massTon, timestamps, quality columns) — represent the voxelized stockpile state. Each cell has spatial coordinates, mass, temporal metadata, and multiple quality attributes.
Belt blocks — (position, massTon, timestampOldest, timestampNewest, qualities) — carry conveyor material composition with temporal bounds showing when the material entered and when it was last updated.
The dense binary Arrow format enables sub-second loading of voxel datasets with thousands of cells. The entire architecture is local-first — no external services, no database, no network dependencies. The visualizer reads pre-computed cache from the local filesystem.
Technical Foundation
The application runs on Next.js 16 (App Router) with React 19 and TypeScript 5. Circuit diagrams use @xyflow/react with dagre for automatic graph layout. 3D stockpile rendering uses @react-three/fiber with Three.js and drei, leveraging WebGL instanced mesh for efficient voxel visualization. Zod 4 validates data contracts at runtime, catching schema mismatches before they reach the rendering layer.
Technology Stack
Application Screenshots