Aerovia, an Underground Ventilation Design and Analysis Workbench in the Browser
Draw a ventilation network in 3D, place boundaries and fans, and solve it: flow, pressure, paths, recirculation, fan duty, sensitivity, energy and baseline comparisons, then release a conservative passive tracer with pulse or continuous sources, scheduled changes, timeline playback and a complete mass ledger. Trained MLP and graph models ship as 24 ONNX exports with their held-out approximation limits stated. Twelve authored network cases, 33,792 learned dataset states and a 216-cell benchmark are reproducible from the public scripts; imports, numerical workers and inference all run in the browser. The networks are planning inputs, not measured operational mines, and no industrial saving or field calibration is claimed. A first version was rejected and rebuilt in full from the CAOS template.
Business Context
A ventilation plan decides fan energy, which is one of the largest continuous power loads of an underground mine, and it decides whether a face can be worked after a blast or a diesel event. A workbench that lets a planner draw an alternative, solve it and watch a tracer clear the circuit, with the energy and the fan duty on the same screen, shortens the loop between an idea and a number. The learned models exist to make that loop faster on repeated designs, and they ship with the limit at which they stop being trustworthy. What the product does not offer is the claim: the twelve networks are authored planning inputs, no operational mine was measured, and user acceptance, industrial savings, field calibration and adoption are explicitly not claimed.
Strategic Value
Aerovia is the case in the line where a rejected first version was replaced rather than patched. The v0.02.000 rebuild is recorded in a release receipt that ties source promotion, executed pipelines, public runtime verification and downloadable artifacts to exact commits, and the public site passed 34 Chromium journeys without retries, five direct-route refresh checks and all 24 model inference checks; every one of the 119 runtime files and a daily monitor are verified against the deployed commit. Code and authored networks are Apache-2.0. The separately authorised drillhole product, Sondara, is the sibling that grew from the same rebuild discipline.
The Challenge
Underground ventilation is a network problem with a spatial body: airways have lengths, grades and resistances, fans have curves, and the questions a planner asks are about paths, recirculation and what happens to a contaminant released at one face over the next hour. The commercial tools that answer them are desktop products with closed formats. A browser workbench has to hold the whole loop, from drawing the network to reading a mass ledger, without a server, and it has to say what its learned surrogates can and cannot approximate. The first version of this product did not reach that bar and was rejected; the rebuild started again from the product template with the shared shell, and the rejected version is recorded as such.
Our Approach
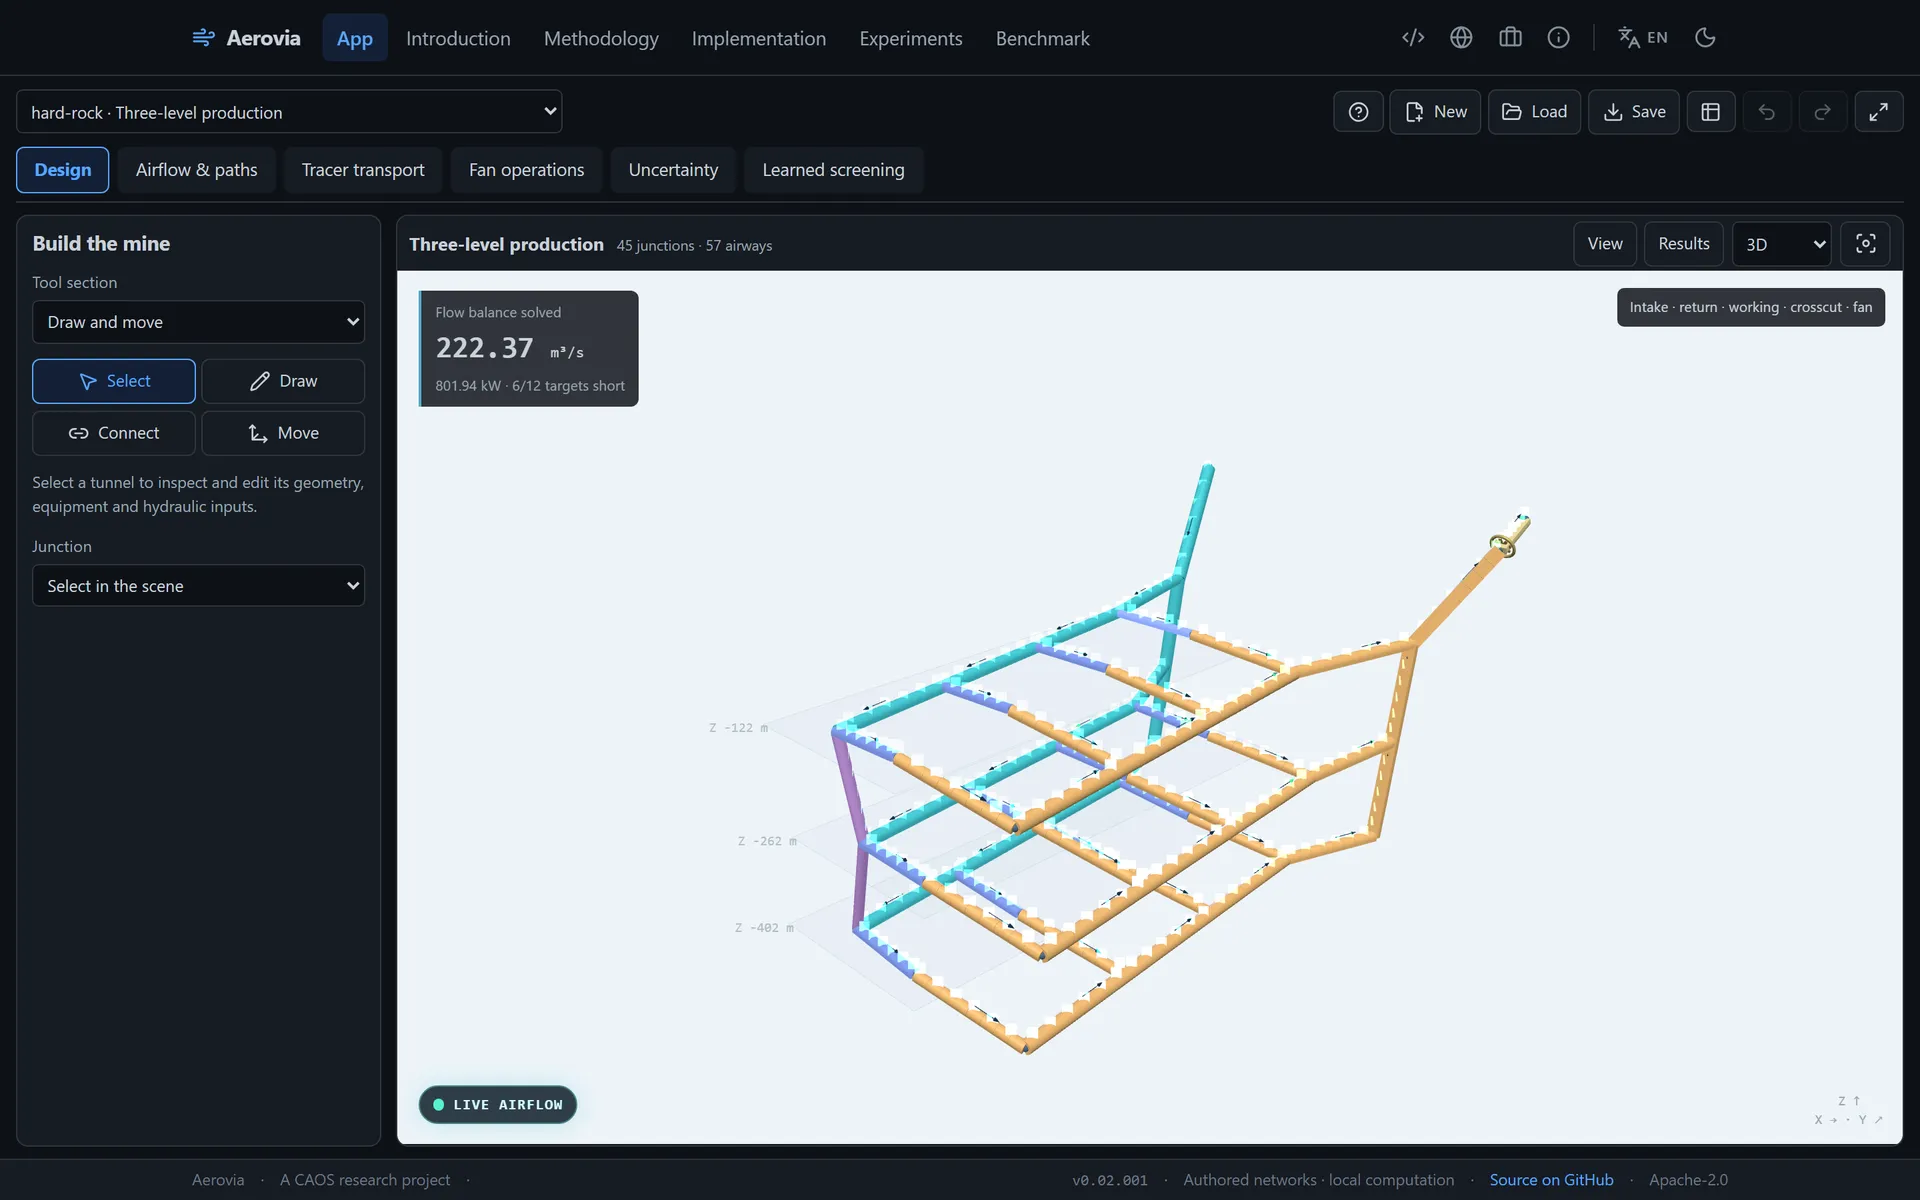
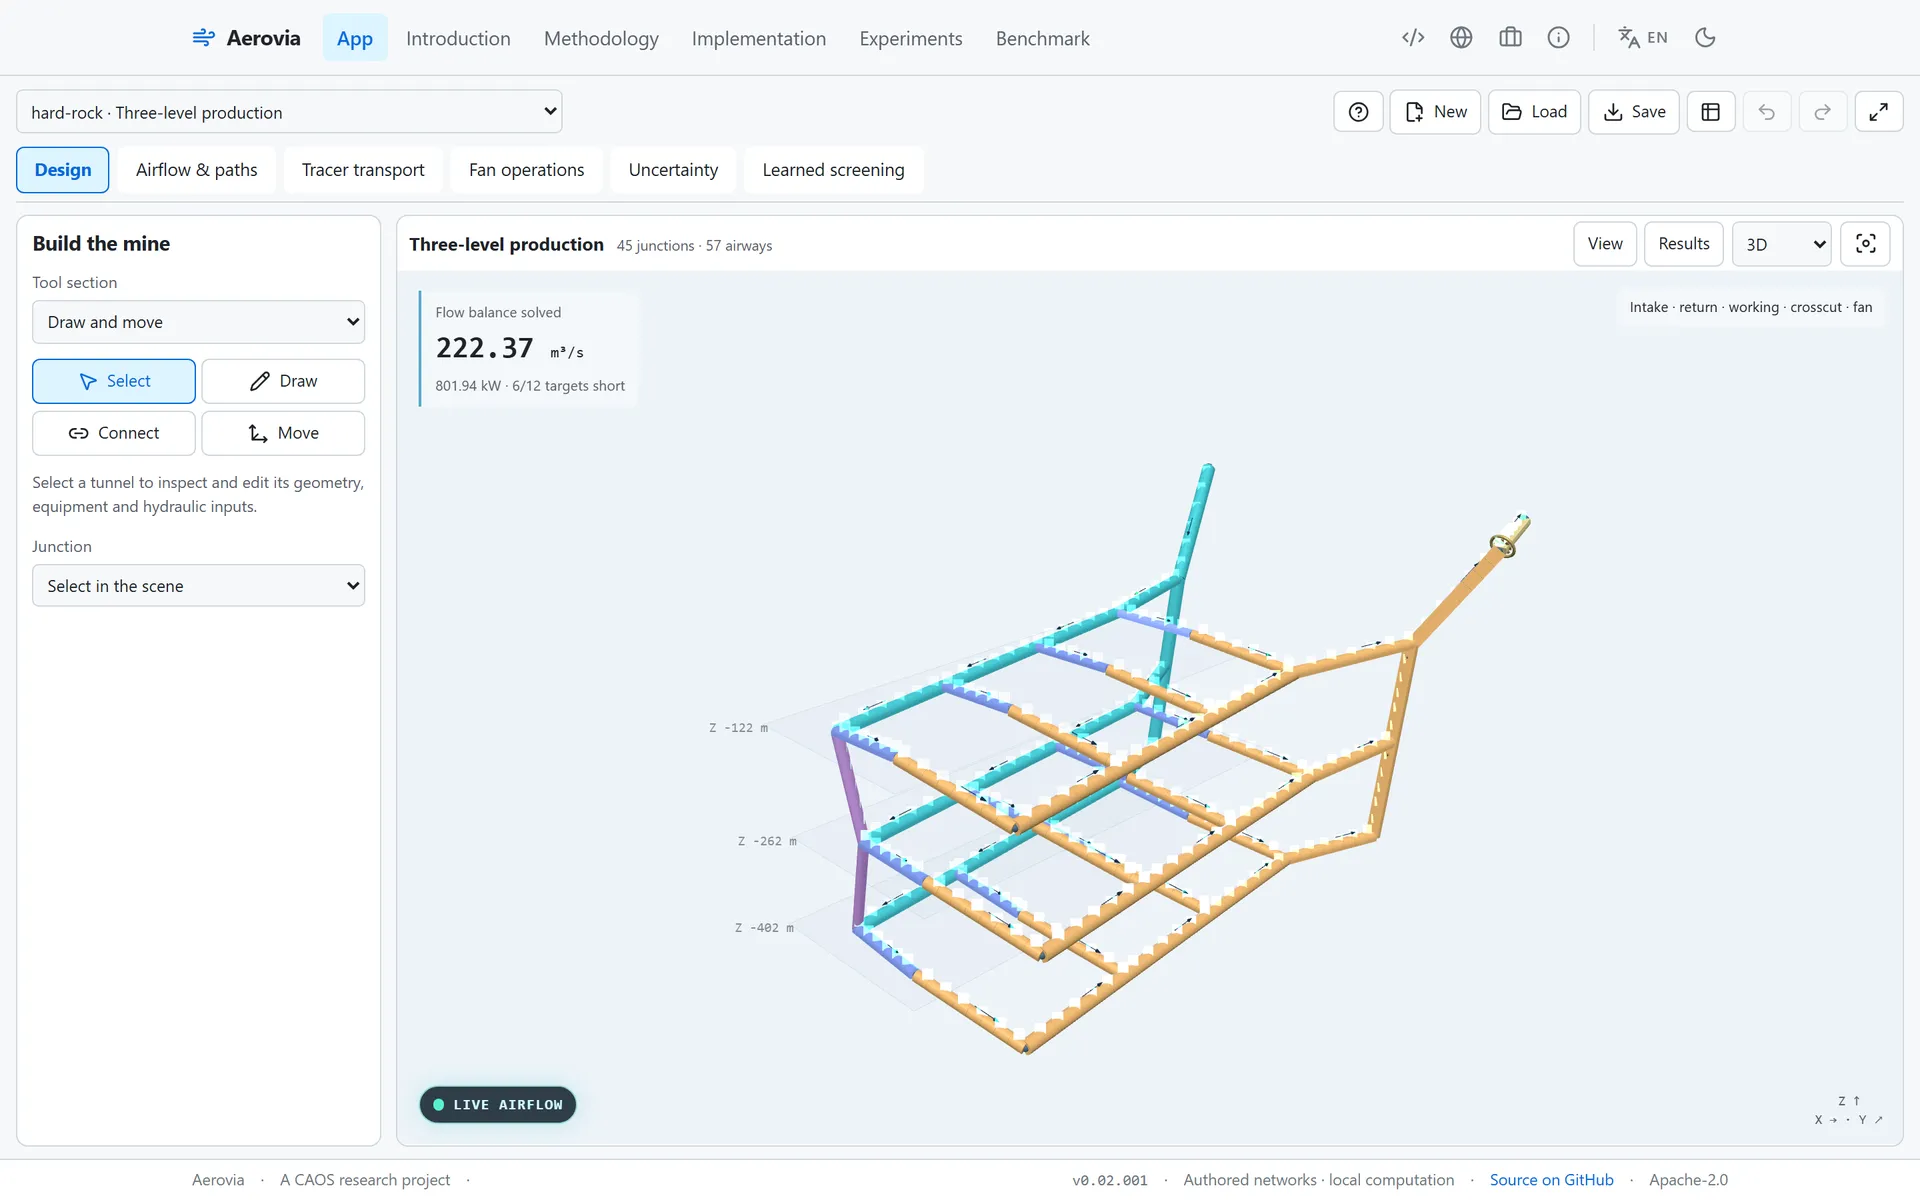
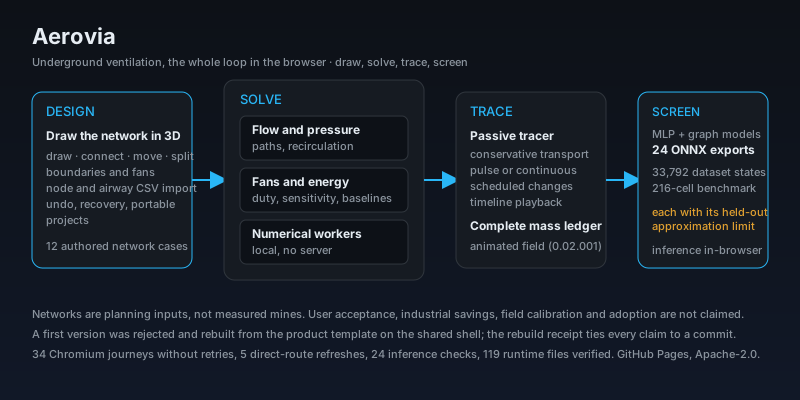
Direct spatial design in the 3D instrument: draw, connect, move and split airways, set boundaries and fans, import mapped node and airway CSV, undo and recover, and carry a project as a portable file. The numerical tools link flow, pressure, paths, recirculation, fan duty, sensitivity, energy and baseline comparisons on the same network. Transport is a conservative passive tracer with pulse or continuous sources, scheduled changes, timeline playback and complete mass ledgers, and since 0.02.001 the solved airflow field is animated: moving tracer particles from the signed transport field, concentration-aware colour, animated fan rotors and a live-airflow marker, paused while the architecture dialog is open. Trained MLP and graph models keep their checkpoints and ship as 24 ONNX exports with held-out approximation limits, so a learned answer is labelled by how far it may be from the solver. The published CAOS shell supplies six bilingual, themed routes and the architecture modal; one tool pane accompanies the dominant instrument and focus fills the viewport. GitHub Pages is sufficient because imports, numerical workers and inference run locally in the browser; the heavy reference and GPU processing runs with public local scripts, and twelve authored network cases, 33,792 learned dataset states and the complete 216-cell benchmark are reproducible from them.
Key Performance Indicators
| KPI | Baseline | Result | Impact |
|---|---|---|---|
| The whole loop in the browser | Desktop tools with closed formats; a server for anything numerical | Draw, solve, trace and infer locally: imports, numerical workers and 24 ONNX models run client-side on a static site | No installation, no data leaves the machine |
| Learned answers with their limit attached | A surrogate returns a number with no statement of trust | MLP and graph models keep their checkpoints and ship with held-out approximation limits over 33,792 dataset states and a 216-cell benchmark | The planner knows when to fall back to the solver |
| A rejected version, replaced | v0.01.000, rejected by its owner | v0.02.000 rebuilt from the product template on the shared shell, with a release receipt tying evidence to exact commits; v0.02.001 adds the animated airflow field | The rejection is part of the public record |
Architecture
aerovia pipeline
Technology Stack
Application Screenshots